Start situation: basic screen layout
Important
Ready for review
The explorer
The principal window of the computational framework is called the explorer. The explorer have the following elements: the drop-down menus, side panels, tabs, log panel and status bar (Explorer overview).
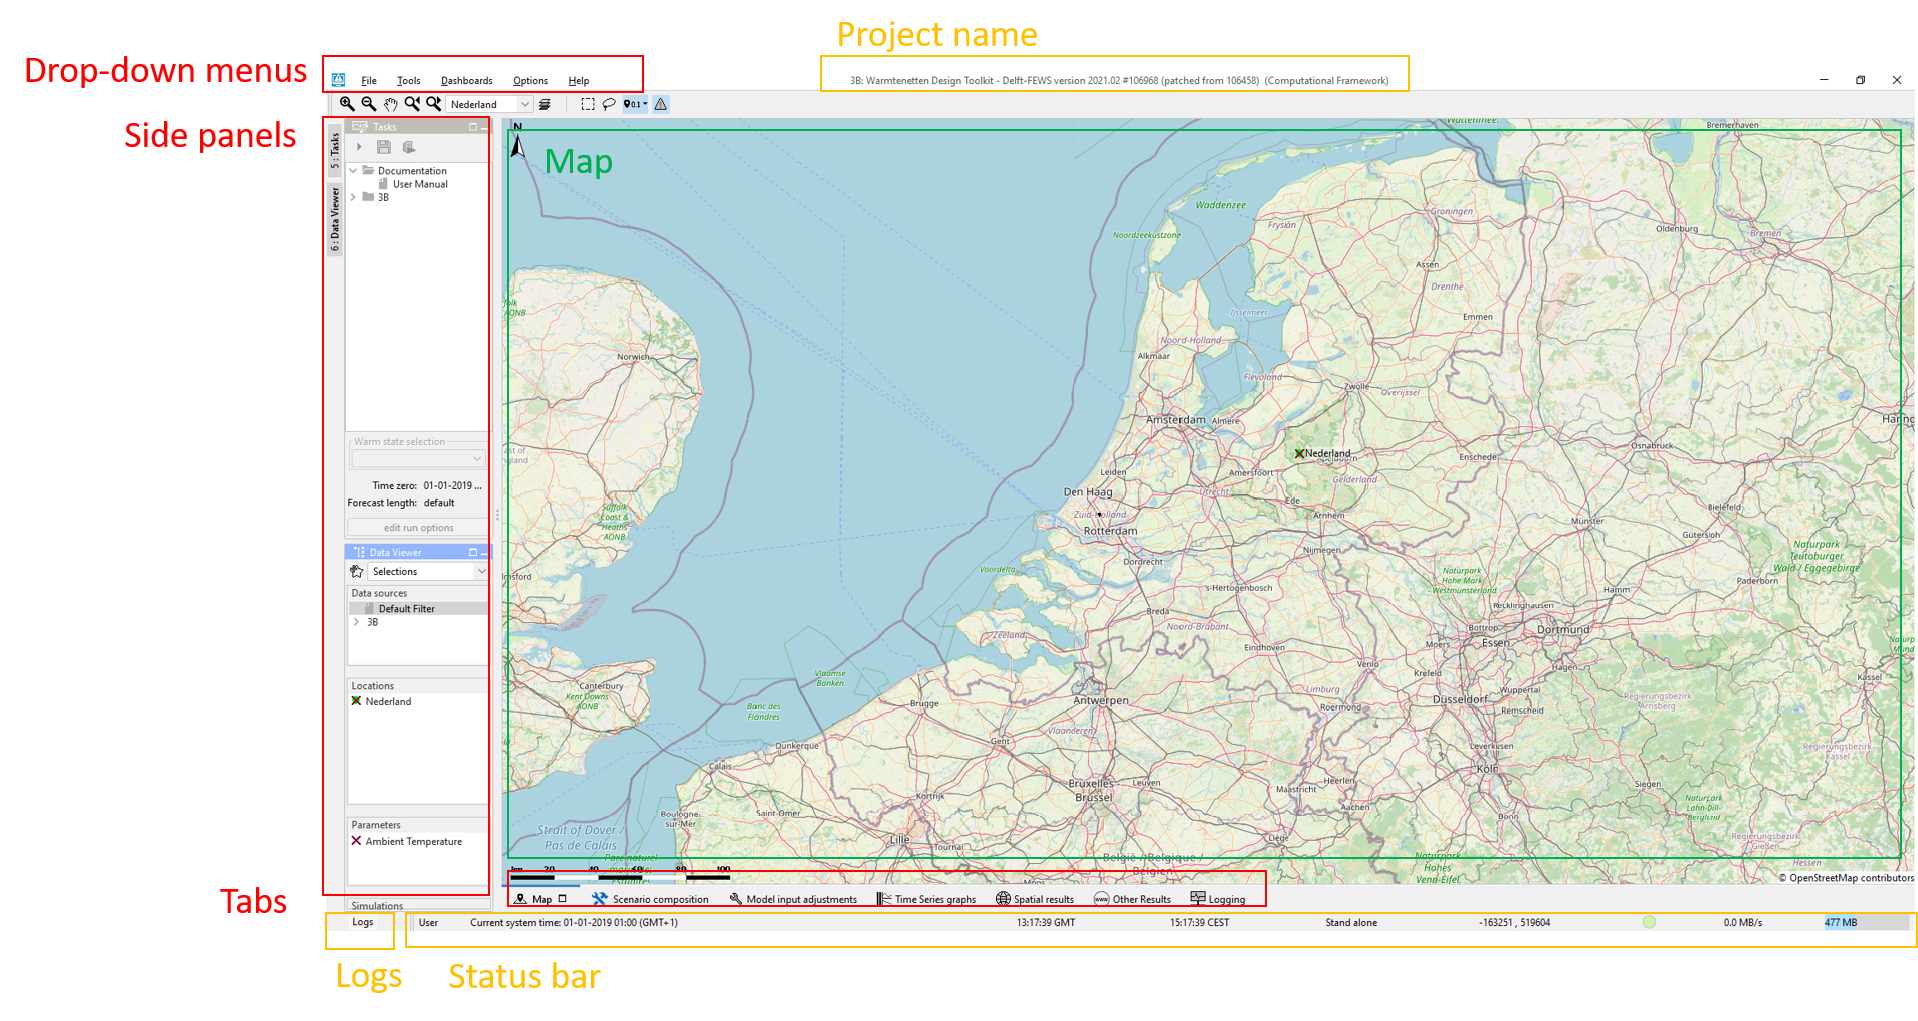
Explorer overview
In the middle of the explorer, the Map tab is open by default. It provides a overview map of the study area. There are various map controls at the top of the Map (Map controls). Use the using the drop-down list in the map controls to adjust the zoom extent to current network.
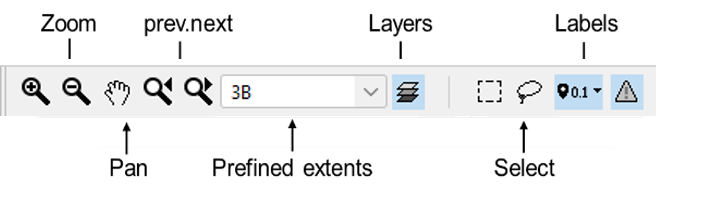
Map controls
Side Panels
Side panels guides the users to navigate workflows and locations. There are two side panels configured:
Tasks
Located at the top of the left panel, the Tasks tree gives an overview of various workflows managed in the computational framework.
User could modify and run workflows in the Tasks tree.
See Tasks Tree for more information.
Data Viewer
Th second side panel - Data Viewer - is used to identify the scalar data associated with the locations on the map.
It is possible to filter the locations based on pre-defined filters, manual selection and parameters.
More information about the Data Viewer are given in Results viewing.
Tabs
Tabs allows user to easily access displays that are frequently used.
Model input adjustment tab allows user to adjust model inputs and parameters.
scenario composition tab allows user to create, modify and delete scenarios.
Time Series graph, Spatial results, and Other results tabs allow user to view the model results. Other results tab is a web browser that allows pr-configured web page to be opened.
Logging allows the user to access previous run status and logging messages.
More information about the included tabs are given in the next sections.
Drop-down menus
The drop-down menu bar provides access to all panels/displays configured in the computational framework. Positions of the side panels and expand or dock options of all display windows can be customized and saved using File/Save layout option.
Logs
The Logs panel unfolds when clicking on the Logs button. It displays high level messages generated by the model and the computations framework itself.
Status Bar
The Status Bar provides information about the status of the system.
Tasks Tree
Tasks Tree
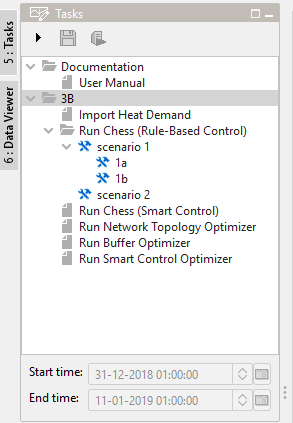
the Tasks tree is to guide the user through various model workflows including model input and run time adjustments, scenarios compositions and model executions (Tasks Tree). The Tree is composed of a set of folders and nodes. The nodes can be associated with displays and/or workflows to run a computation. The workflow nodes can be duplicated and/or modified to compose scenarios. Once a scenario is created, the node will turn into a folder.
The first root folder Documentation holds one node User manual which is linked to the webpage of Warming Up Design Toolkit documentation.
Th second root folder is the network folder. It is initialized with six Network Design workflow nodes:
one general workflow
Import Heat Demandthat imports User defined series specified in th ESDL model, e.g. Heat demand profiles.five model-based design workflow nodes that modify the network attributes and model parameters, and run the model for analysis
With some tasks, the associated display atomically open the pre-configured display. However, the user is free to go to other displays for inspection and analysis.